針と数字で、ひと目でわかるA hand for the flow, digits for the detail
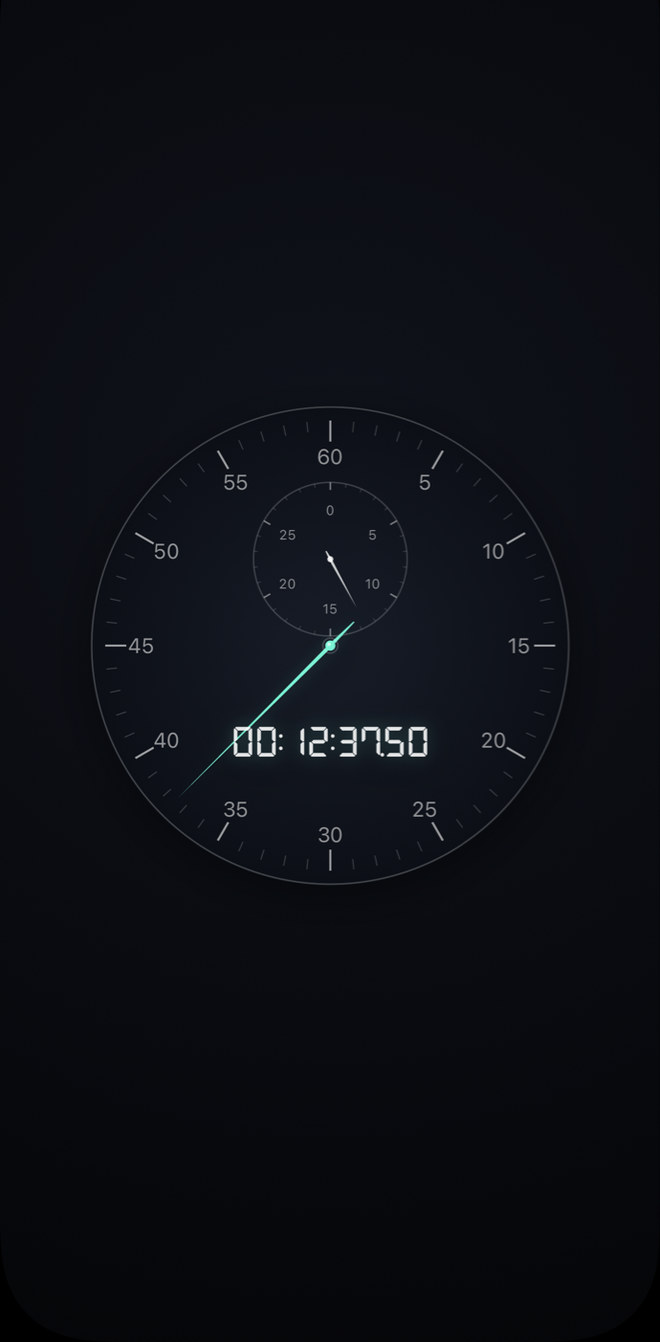
アナログの針が経過をなぞり、7セグメントの数字が100分の1秒まで示します。開始した時刻をもとに計算するので、アプリを閉じても計測は続きます。
The analog hand traces elapsed time while seven-segment digits show it to the hundredth of a second. Timing is based on when you pressed Start, so it keeps going after you close the app.
何に使った時間か、色で分けるSort your time by color
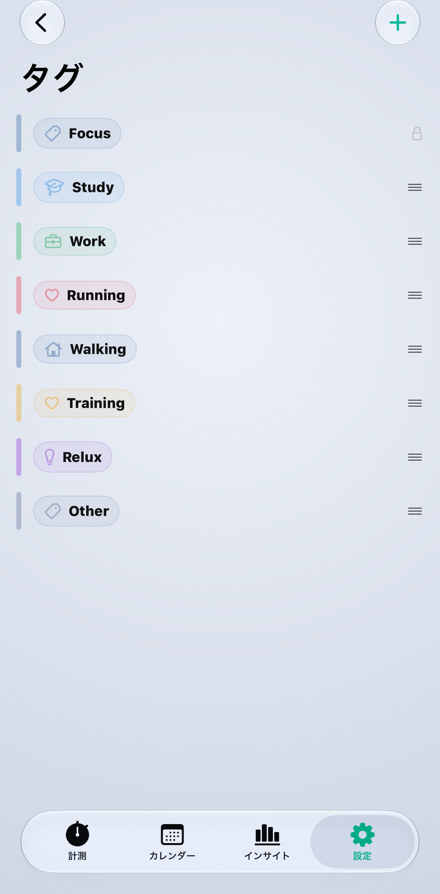
仕事、勉強、運動など、計った時間にタグを付けます。タグごとに色とアイコンを選べます。無料版では2個まで、Pro では9個まで作れます。
Tag each session as work, study, a run, or anything you like. Every tag gets its own color and icon. Create up to 2 tags for free, or up to 9 with Pro.
毎日の合計が、カレンダーに並ぶDaily totals, right on the calendar
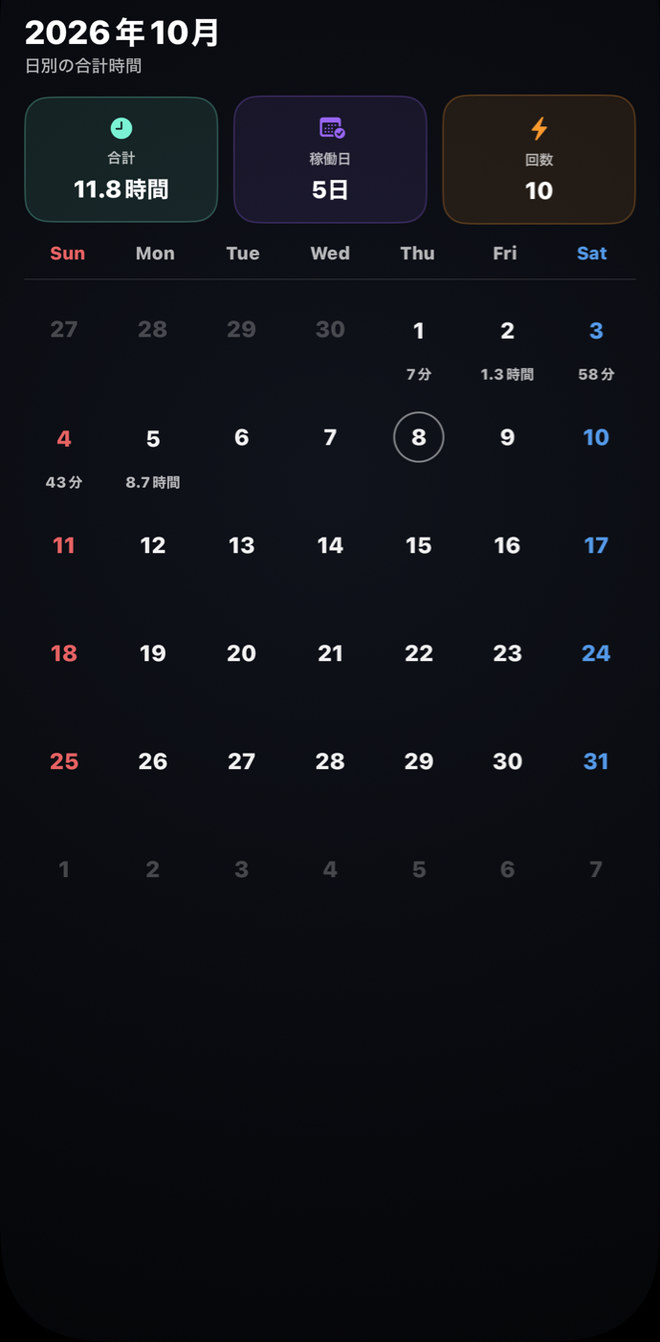
日ごとの合計時間をカレンダーに表示します。月の合計、記録した日数、回数もひと目でわかります。日付を押すと、その日の記録を確認できます。
See each day’s total on the calendar, along with the month’s total time, active days, and sessions. Tap a date to see that day’s records.
週と月の積み重ねを、グラフでWeekly and monthly charts
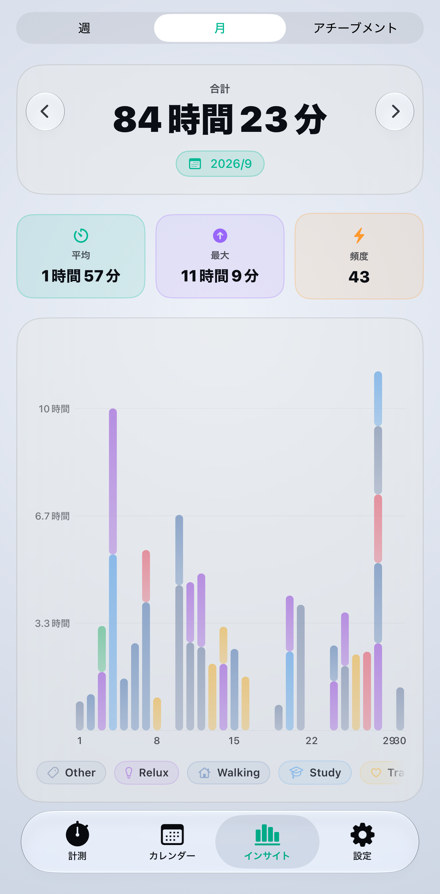
週ごと、月ごとの時間を、タグ別に色分けした棒グラフで表示します。平均、最大、回数もまとめて確認できます。
Weekly and monthly bar charts, colored by tag, with your average, longest, and number of sessions alongside.
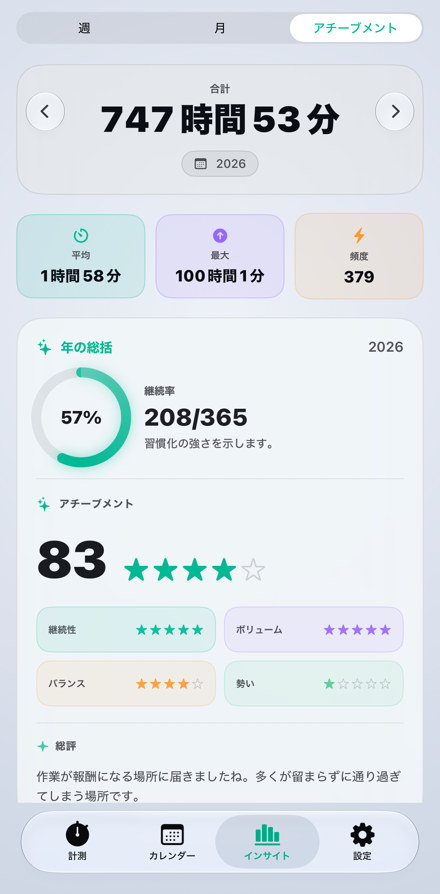
1年の継続を、スコアで見るA year of consistency, scoredPRO
年間の継続率、アチーブメントのスコアと評価、ハイライトをまとめて表示します。Pro で使える機能です。
Your yearly consistency rate, an achievement score with ratings, and highlights, all in one view. Available with Pro.
 Tokira